TransForm’s GreenTRIP Parking Database includes data gathered at multi-family residential sites around the San Francisco Bay Area. The data shows parking supply and utilization at each site and information about the residential units in the building. You can browse the parking database, or apply selection criteria to search for sites.
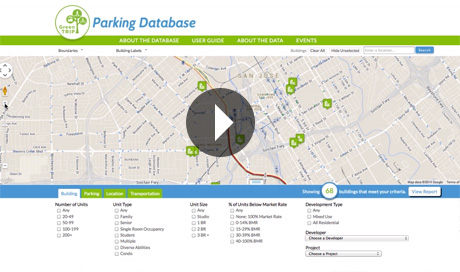
If you’d like to watch a video tutorial on how to use the GreenTRIP Parking database, clicking on the arrow in the image below will play the video. Otherwise, you can continue to read our online user guide below that explores the many features of the tool.
Begin by entering a location in the address above the map on the right side. Click the “Search” button and the map will zoom to that location. You may enter an address, zip code, neighborhood, city or county name. For this example we have typed in San Jose.
![]()
You can use the Google controls on the left side of the map to zoom in and out, and go to google streetview. As you zoom in on the map, the map will become more detailed, and you will see, transit lines, transit stations, bus stops, and car sharing sites.
![]()
Clicking on the “Boundaries” drop down menu gives you the option of displaying no boundaries, or outlines of priority development areas, county or city boundaries on the map.
![]()
In the example below, "Cities" has been selected.
![]()
Clicking “Building Labels” gives you a drop down menu of map themes to display. Options include building icons; Housing Affordability, which indicates whether a building’s rents are market rate or affordable; % of Parking Unused, which indicates high, medium or low levels of excess parking provided at a building.
![]()
In the example below, the "Housing Affordability" label has been selected.
![]()
Next to "Buildings" are buttons that allow you to Select or Clear All buildings, and Hide or Show unselected buildings. For all building label types, the marker background will be white if the building is not selected.
![]()
Clicking on a building label on the map pops up an information box where building and parking information is displayed.
![]()
The Building tab includes property information such as location, number of units and unit type. Clicking on the “Building Report” button provides a print-ready 2 page Building Report. You may click on the “zoom to building” button to zoom to the building’s location. Clicking on “Deselect Building” button unselects the building, while “Add to Selection” selects a building.
![]()
The Parking tab includes number of parking spaces, parking space usage, and traffic reduction strategies available to residents. The “Building Report”, “zoom to building” and “select / deselect” buttons are also available.
![]()
Below the map is the “View Report” button. Clicking on the “View Report” button takes you to the Comparison Report.
![]()
The Comparison Report provides information on all selected buildings. Aggregated summary statistics for all selected buildings, including aggregated total parking spaces, number of unused parking spaces and cost of unused parking spaces are given.
![]()
The number of buildings in the Comparison Report and any filters applied are reported. You may clear all filters by using the “Clear All Criteria“ button. Clearing all filters shows all buildings. You may individually clear filters by clicking on the “x” next to the filter.
![]()
Below the summary statistics, each building is listed individually, and includes information on building parking, residential units and transportation information. You can sort the buildings by clicking on the column headings. Clicking on the building name generates a detailed print-ready Building Report.
![]()
When you first arrive at the website, the default view is to show all buildings on the map and in the Comparison Report.
You can choose to narrow the selected buildings on the map and in the report by applying search criteria based on building, parking, location and transportation characteristics. Each time you apply a criteria, the number of buildings selected will update, the map will update and your filter criteria will be displayed, and the comparison report will update. You may select as many criteria as you like.
![]()
Using the checkboxes you can specify buildings by the number of units, unit type, unit size, % of units below market rate. A drop down menu of developer and project names can be used to select buildings. In this example we have chosen Development Type: Mixed Use. The number of buildings selecting meeting these criteria is 25.
![]()
Clicking on the Parking tab gives options to specify buildings by Average Parking Spaces/Unit Provided, % of Used Spaces, Parking Type, Surrounding Street Parking, Assigned Parking and Parking Permits. In this example we have chosen Parking Type: Structure. The number of buildings selected is now 14.
![]()
Using drop down menus you can select buildings by their location in a particular County, City, Place Type and Priority Development Area. In this example we have chosen City: San Jose. The number of buildings selected is now 5.
![]()
You may click on the Transportation tab to use the checkboxes to specify buildings by Traffic Reduction Strategy and Transit Type characteristics. A drop down menu of transit agencies is also provided, and the option to select by proximity to transit. In this example we have chosen Transit Type: Light Rail. The number of buildings selected is now 4.
![]()
Based on your filters, your Comparison Report now has 4 buildings, and the summary statistics and report filters have been updated to reflect your filters. In this example, the summary statistics and filter criteria reported now show:
![]()
If you would like to change your criteria, you may clear all filters by using the “Clear All“ button. You may individually clear filters by clicking on the “x” next to the filter you would like to remove.
![]()
Once you have selected buildings that you are interested, in you may click on the “Download .CSV” button to export a .CSV file with the data for each building in your in the Comparison Report.
Clicking on the “View for Print” button provides a print-ready layout of the map, key summary statistics, and each individual building’s information.
![]()
In this example, here is what the Comparison Report print version looks like. You may use your computer's print dialogue box to print the report, or save it as a .PDF file.
![]()
You can create a Building Report for the buildings in your Comparison Report. Click on the name of the building to create the Building Report. In this example we have chosen Gish Apartments.
![]()
The Building Report is a two page printer friendly report with building details. On the first page, some of the information includes the name, address, photo, year developed, developer, number of units, and affordability. A resident and residential parking profile, including parking availability and usage, are detailed.
![]()
On the second page, included are a map, parking information, and traffic reduction strategies available to resident on site and in the surrounding neighborhood.
![]()
You may use your computer's print dialogue box to print the report, or save it as a .PDF file. When you are done viewing or printing, you can return to the Comparison Report, and continue the steps above and print all your Building Reports.
If you would like to download a file of all buildings, make sure all 68 buildings are selected, and click on the “Download .CSV” button to export a .CSV file with the data for each building.
![]()
You can find more information about the data, including a glossary of terms and specific sources here.